Internal system
Live Signal Intelligence
A distributed pipeline that detects live streams, records audio, transcribes it and turns relevant context into actionable signals using a locally hosted language model.
- Role
- System Architecture & Full-stack Engineering
- Period
- 2024—present
- Categories
- FrontendBackendInfrastructure
- Stack
- TypeScriptFastifyReactVitePrismaPostgreSQLZodFFmpegGPU transcriptionLocal LLMDocker
Key metrics
- Streams processed on average
- ≈168K/year
- Annualised average from the benchmark model.
- This is a modelled average, not historical usage.
- Audio analysed on average
- ≈390K h/year
- Annualised average from the benchmark model.
- This is a modelled average, not historical usage.
- Segments processed on average
- ≈35M/year
- Annualised average from the benchmark model.
- This is a modelled average, not historical usage.
- Concurrent streams on average
- ≈45
- Average operating point used by the annualised benchmark model.
- This is a modelled operating average, not a configured ceiling or historical load.
Overview
Live Signal Intelligence is an operational system for observing channel presence, capturing live audio and moving selected media through transcription and local language-model analysis. The result is a ranked review surface rather than a collection of raw recordings and transcripts.
The workspace is split into a Fastify control plane, recorder, transcription and insight workers, a shared contract package and a React/Vite operations dashboard. PostgreSQL holds both domain state and durable work so each stage can continue, retry or recover independently.
Challenge
Live media is temporary. Presence can change between discovery and capture, HLS tokens can expire, and a source can fail after a recording job has already been claimed. The system must distinguish a retryable interruption from a completed or permanently unavailable stream.
Recording, transcription and language-model analysis have different resource profiles. Coupling them into one synchronous process would let a slow GPU or model stage block capture and make recovery depend on restarting the whole chain.
The system also handles sensitive channel context and transcript-derived data. Operational visibility is necessary, but raw identities, transcript fragments, ranking rules and internal endpoints must stay private.
Solution
A Fastify control plane records discovery and presence transitions, then schedules database-backed jobs. Shared Zod contracts keep commands and worker payloads consistent across the TypeScript workspace.
FFmpeg recorder workers claim capture jobs and handle expired HLS tokens and transient source failures through controlled reacquisition and retry paths. Completed audio moves through a separate transcription queue and GPU worker stage before analysis jobs reach a locally hosted language model.
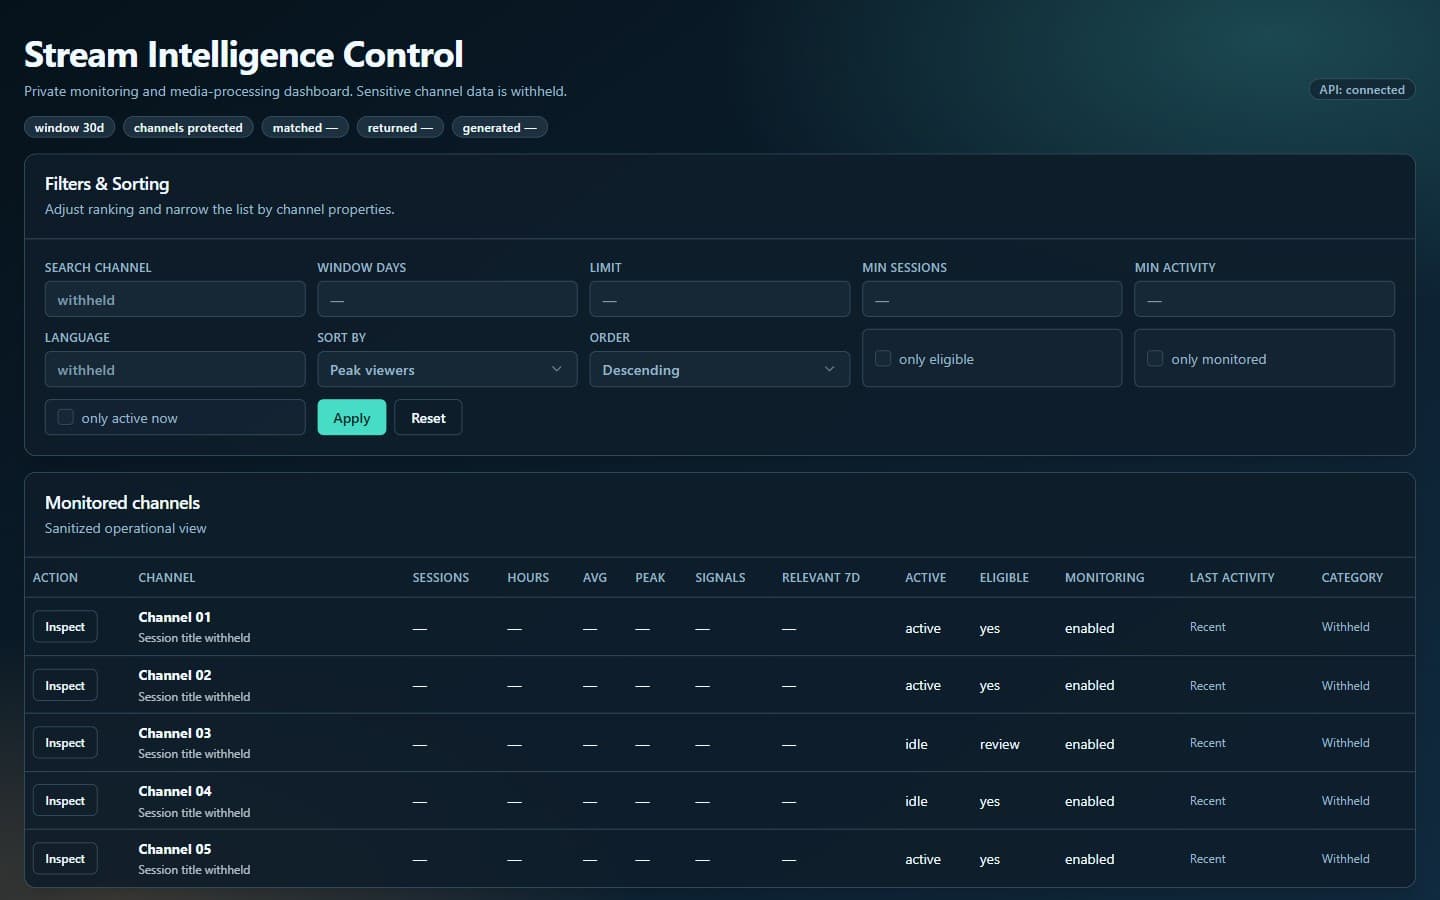
Analysis produces ranked, actionable signals for review without exposing the model endpoint or raw transcript content to the public interface. A React/Vite dashboard surfaces monitoring state and pipeline status, while Docker profiles let the control plane and each worker class run according to its own resource needs.
Responsibilities
- Design the control-plane, queue and worker boundaries for the end-to-end media pipeline.
- Implement channel discovery and presence-state transitions without coupling them to long-running media work.
- Build FFmpeg recording workers with explicit recovery for token expiry, unavailable sources and interrupted jobs.
- Separate GPU transcription and local language-model analysis into independently operated queue stages.
- Define shared Zod contracts and PostgreSQL-backed job state across the TypeScript workspace.
- Build the React/Vite operations dashboard and package services into focused Docker profiles.
Architecture
Interface
React stats dashboard
Services
Fastify control plane
FFmpeg recorders
GPU transcription workers
Local LLM workers
Data
Recording queue
Audio artifacts
Transcription queue
Analysis queue
Ranked signals
Automation
Channel discovery
Infrastructure
Docker profiles
Presence observations to control plane
Channel discovery -> Fastify control plane
Eligible transitions schedule recording
Fastify control plane -> Recording queue
Durable jobs to recorder workers
Recording queue -> FFmpeg recorders
Completed audio artifacts
FFmpeg recorders -> Audio artifacts
Audio schedules transcription
Audio artifacts -> Transcription queue
Transcription jobs to GPU workers
Transcription queue -> GPU transcription workers
Completed transcripts schedule analysis
GPU transcription workers -> Analysis queue
Analysis jobs to local model workers
Analysis queue -> Local LLM workers
Validated ranked signals
Local LLM workers -> Ranked signals
Review state for the dashboard
Ranked signals -> React stats dashboard
Operational status and channel state
Fastify control plane -> React stats dashboard
Control-plane Docker profile
Fastify control plane -> Docker profiles
Recorder worker Docker profile
FFmpeg recorders -> Docker profiles
GPU worker Docker profile
GPU transcription workers -> Docker profiles
Insight worker Docker profile
Local LLM workers -> Docker profiles
Technical decisions
Keep work state in PostgreSQL
- Problem
- Recorder, transcription and analysis jobs must survive process restarts and remain inspectable beside the domain state that created them.
- Decision
- Model queues, claims and job transitions in PostgreSQL and access them through the shared Prisma data layer.
- Reason
- The control plane and workers share one durable source of truth, making incomplete work visible and recoverable without introducing another stateful broker.
- Trade-off
- Database-backed claiming needs careful locking, polling and retry policies and is not intended to maximize raw queue throughput.
Separate every resource boundary
- Problem
- Media capture, GPU transcription and local model inference consume different resources and fail for different reasons.
- Decision
- Give recording, transcription and analysis their own queues, worker processes and Docker profiles.
- Reason
- Backpressure or failure in one stage does not stop channel discovery or active recording, and each worker class can recover on its own.
- Trade-off
- More stage transitions create additional job states that the control plane and dashboard must explain.
Treat live sources as renewable inputs
- Problem
- An HLS URL can expire or become temporarily unavailable while a recorder still has valid work to complete.
- Decision
- Classify source failures, reacquire media information when appropriate and retry from explicit job state instead of treating every process exit as final.
- Reason
- Temporary source behavior remains a recoverable operational condition rather than silently losing the rest of the pipeline.
- Trade-off
- Recovery adds delay and cannot guarantee that every transient media segment remains available.
Run analysis locally
- Problem
- Transcript-derived context is sensitive and should not be sent to an unrelated hosted model service.
- Decision
- Send analysis jobs to a locally hosted language model and validate the structured result before ranking it for review.
- Reason
- Model traffic remains inside a restricted runtime and the rest of the pipeline consumes a controlled contract instead of free-form output.
- Trade-off
- Inference capacity, model availability and upgrades become part of operating the system.
Media
Gallery
Outcomes
- Discovery, capture, transcription and analysis can progress and recover as independent stages rather than one fragile synchronous process.
- Explicit job state and source-failure classification provide a clear recovery path for interrupted recording and delayed downstream work.
- The operations dashboard makes monitoring and pipeline state reviewable without granting direct access to worker processes or sensitive transcript content.
Verified highlights
- The workspace contains separate control-plane, recorder, transcription, insight and dashboard applications.
- PostgreSQL and Prisma persist domain data and database-backed queues shared by the worker stages.
- FFmpeg capture includes recovery paths for expired HLS tokens and transient source failures.
- GPU transcription and locally hosted language-model analysis run after capture as separate jobs.
- The React/Vite dashboard, shared Zod contracts and Docker profiles are part of the internal operating system.
- In the same annualised benchmark model, average yearly throughput is approximately 15 TB of audio and approximately 1.3B transcribed words.
Learnings
- For live media, retryability is a domain state: an unavailable source, an expired token and a completed stream require different next actions.
- A useful AI pipeline depends more on durable boundaries, inspectable state and controlled contracts than on presenting the model as a standalone feature.